Google Earth Engine Application
FABLE Zonal Statistics Extractor
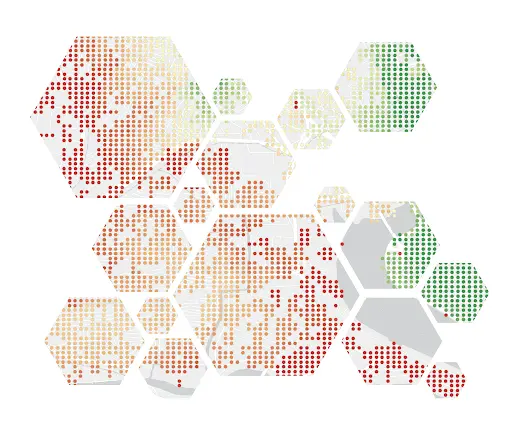
An application to extract zonal statistics for selected data sources at a 50km grid resolution for any country.
Tracking and localizing SDG progress with geospatial data

Geospatial data is critical for monitoring progress on the SDGs, localizing SDG monitoring and policy tools, and informing the development of policies upstream.
The SDGs are highly dependent on geospatial information and Earth observations as the primary data for relating people to their location and place, and to measure where progress is, or is not being made. According to the United Nations Committee of Experts on Global Geospatial Information Management (UN-GGIM), approximately 20% of the SDG indicators can be interpreted and measured either through direct use of geospatial data itself or through integration with other statistical data.
Furthermore, the geospatial dimension enables analysis and identification of trends and patterns, making the SDGs actionable at more fine-grained levels. In transforming these data and statistics into information, policymakers can develop targeted policy action by generating knowledge and insights.
The SDG Transformation Center partners with Esri, and is a contributing member to the United Nations Inter-Agency Expert Group on the SDGs (IAEG-SDGs), a part of the UN Working Group on Geospatial Information (UN-WGGI).
Our work on geospatial data and tools falls into three categories:
Learn more about the state of geospatial data for the SDGs here.
Google Earth Engine Application
FABLE Zonal Statistics Extractor
An application to extract zonal statistics for selected data sources at a 50km grid resolution for any country.
SDG 11.3.1
Land Use Efficiency
Land consumption is the uptake of land by urbanized land uses, which often involves conversion of land from non-urban to urban functions. This indicator focuses on the measures of the total increase in built-up areas within the urban area over time. This indicator can help identify when urban areas become too dense and/or when they become too sparsely populated.
Carbon emissions by deforestation driver
Estimates on the extent to which commodities have replaced forests, while mapping the CO2 emission impact making use of spatially explicit data. Results are reported globally for 52 products at national level, as well as agroecological zones and a 50km cell vector grid.
SDG 11.7.1
SDG 11.2.1
Urban pedestrian accessibility
An assessment of pedestrian accessibility in urban centers. Indicators include the average walking time to different categories of destinations, as well as the proportion of inhabitants that can access each category of services within a 15-minute walk.
SDG 9
Transformation 3
Transformation 4
Infrastructure
Human impact
Microsoft Bing
Global Road Density Index
The Global Road Density Index measures road length density in 10x10km and 50x50km cell grids worldwide. Roads are fetched from the Microsoft Road Detection project, which locates roads by using deep learning algorithms and merges them with OpenStreetMap road data, making it the most complete and up-to-date data currently available publicly.
This dataset is a by-product of the Rural Access Index, but can also be used to determine areas where human presence isn’t identified. This is particular useful for developing indicators related to SDG 15 Life on land.
UN Background Document
Rescuing the SDGs with Geospatial Information
As a member of the UN IAEG-SDGs, the SDG Transformation Center's Geospatial Working subgroup contributed to the white papers in the UN's contribution to the 2025 SDG Indicators Comprehensive Review, along with contributions to the SDG Geospatial Shortlist.
Working paper
Localizing the SDG Index with machine learning and satellite imagery
Using artificial neural networks and high-resolution satellite imagery, we built on existing methodologies to downscale SDG Index scores from national to subnational levels. This model helps to identify aggregation biases in national SDG indicators, revealing that nearly 43% of the global population may be overlooked when only national averages are considered.
Learn more about SDSN's reports, publications and data visualizations in our library
Showing 3 of 3